N° 02 / 08 — Real time · 3D · Open data
LiveRadar
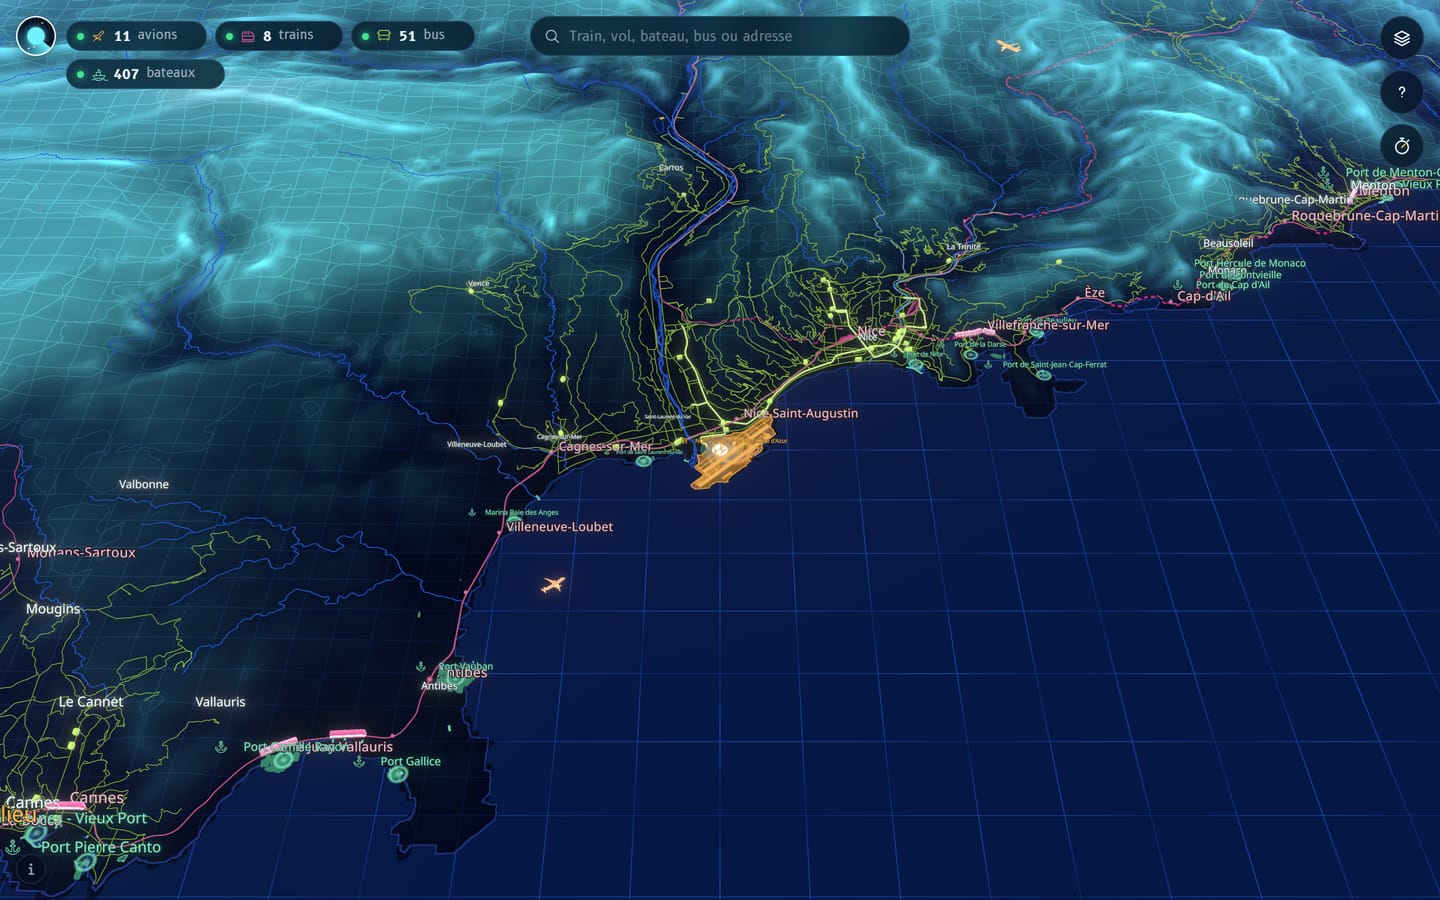
Everything that moves in France, live, on a 3D map: planes, trains, buses and boats. Plus an observatory that counts our delays.
- Role
- Design and development
- Year
- 2026
- Status
- LivePersonal
- Stack
- Next.js · Three.js · TypeScript · PostgreSQL · Drizzle · React Three Fiber
01 / 07
The problem
Transport positions exist as open data, but scattered: one format per network, irregular data, and nothing showing it all in one place.
And nobody was really measuring what people live through every day: how many hours of delay, how many kilometres of traffic jams.
02 / 07
What I did
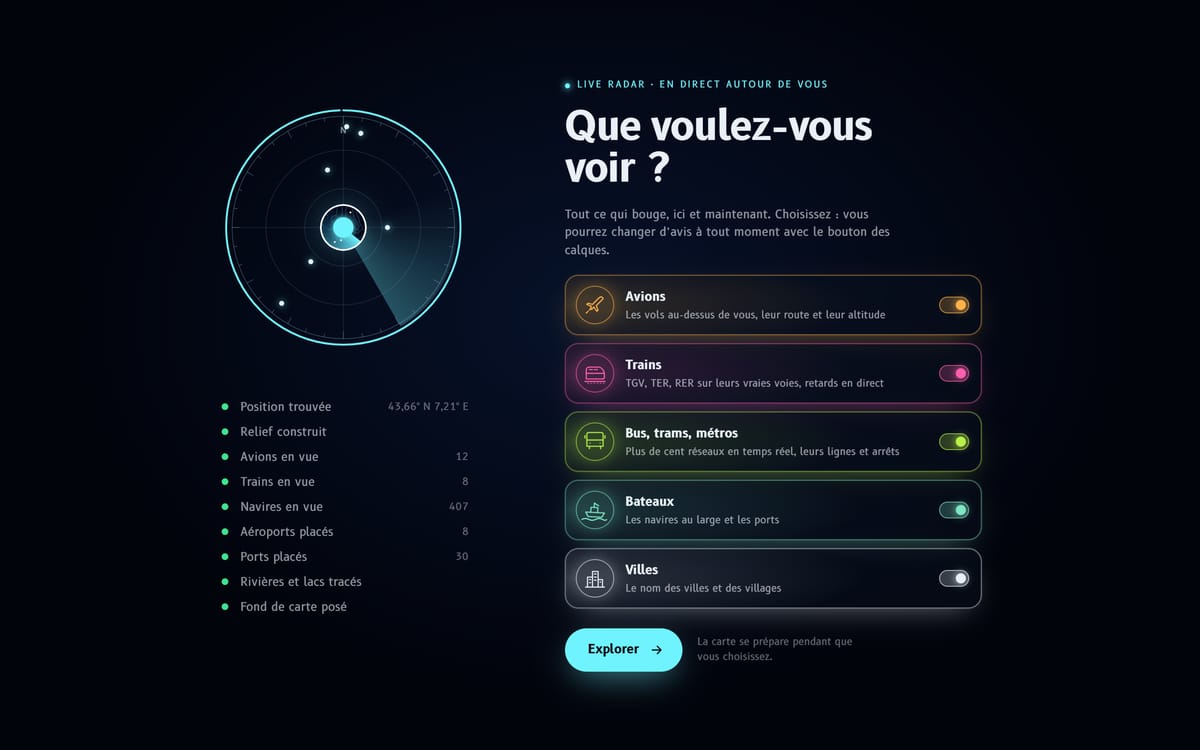
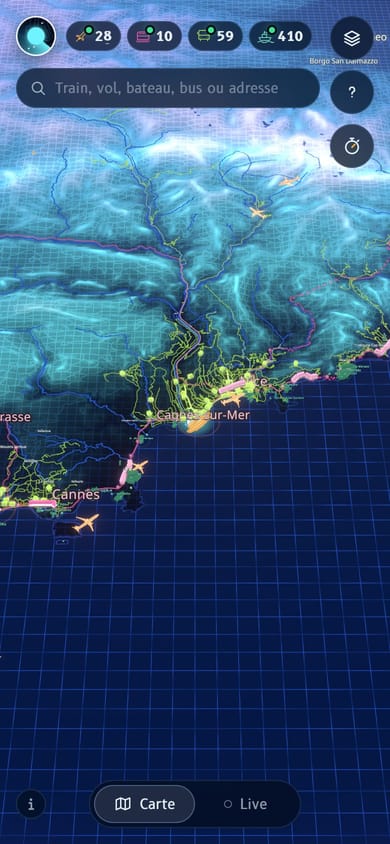
LiveRadar brings together on a 3D relief map planes in flight, SNCF, TER, RER and Transilien trains on their real tracks, buses, trams and metros from over a hundred networks, and ships. A Live view lets you raise your phone to the sky to identify planes.
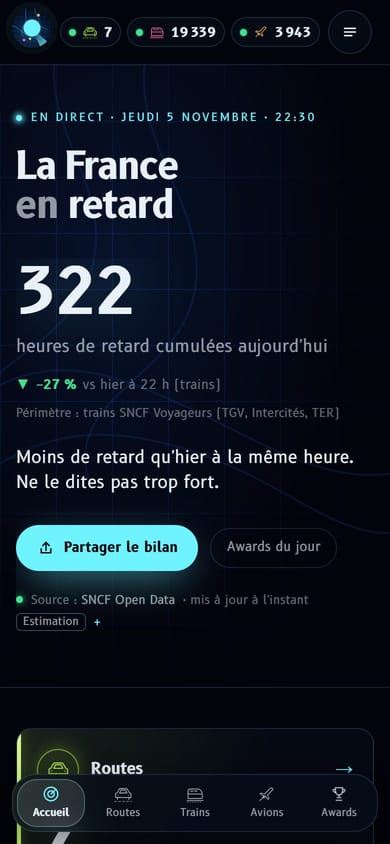
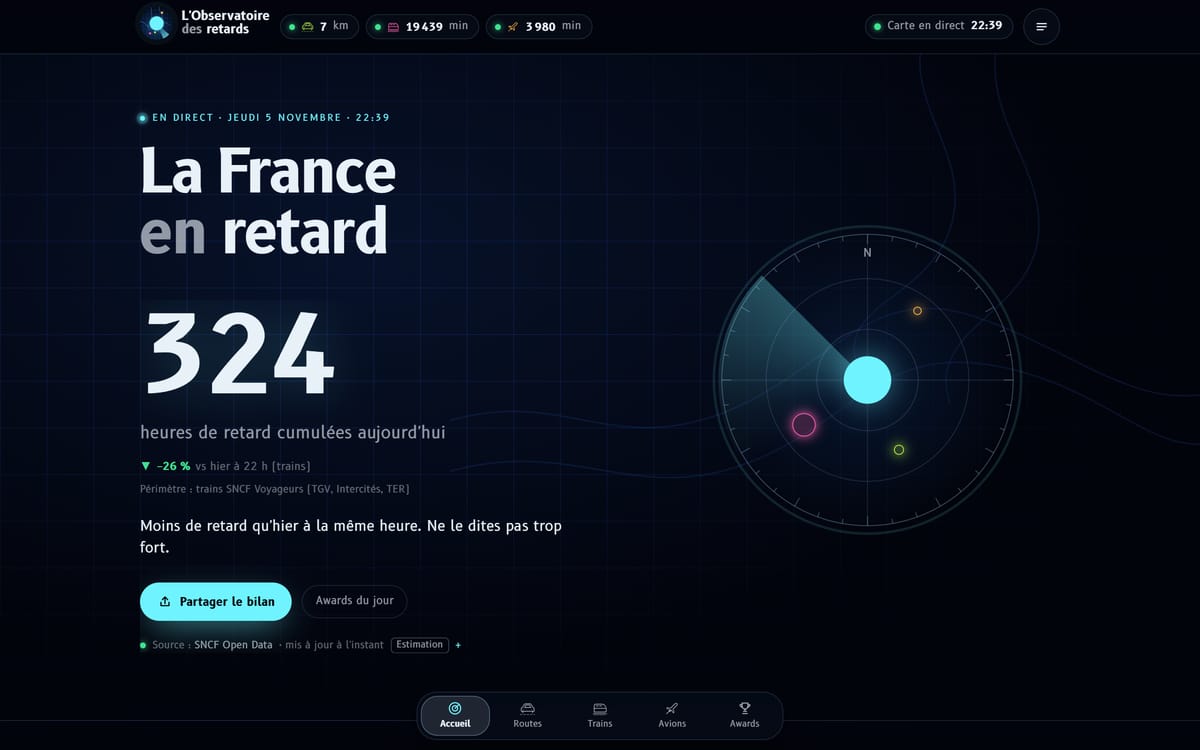
The delay observatory extends the project: it measures train delays, traffic jams and planes, with the day's “awards”, streaks and a disruption index.
03 / 07
How it's built
LiveRadar is a full stack Next.js PWA: workers compute and interpolate positions from heterogeneous data, and Three.js renders them in real time with WebGL.
The observatory has its own collectors (Bison Futé in Datex II, SNCF in GTFS-RT, ADS-B for planes) that store everything in PostgreSQL. The browser never calls the sources directly.
- Open data (SNCF, ADS-B, networks)
- Interpolation workers
- Next.js API
- Three.js 3D map
04 / 07
Challenges
- 01
Data that looks nothing alike
Every source has its own format and rhythm: ADS-B for planes, GTFS-RT for trains and buses, Datex II for Bison Futé. Workers normalise them and interpolate positions between two readings, so everything moves smoothly on the map.
- 02
Fitting on a small server
The whole stack runs on a small shared VPS. The JavaScript heap is capped, the container has its own memory limit, and a safeguard trims the caches before reaching it. A single instance relays air traffic, to respect the source's rate limit.
- 03
Light 3D, even on a phone
3D models are compressed at build time (glTF Transform, Draco, meshopt), and planes are scaled up without ever being moved: readable on a phone screen, accurate on the map.
- 04
Shipping without thinking about it
Every push goes through GitLab CI: types, lint and tests, then a Docker image checked by a smoke test, deployed to Docker Swarm behind an HTTPS reverse proxy, with automatic rollback.
- 05
Being found, being shared
Sitemap, robots, generated Open Graph images and an installable PWA: both sites are built for search and sharing, down to the observatory's daily figures.
05 / 07
Results
Both sites are live. LiveRadar is free, with no sign-up, across France.
The observatory has been building its own history since 2 October 2026, and publishes its methodology and sources.
06 / 07
What I learned
An airliner shown at its true size is 1 to 4 pixels on a phone: accurate, and useless. The answer comes from Stellarium: exaggerate the size, never the position.
That rule served me everywhere: you can cheat on what helps reading, never on the data.
07 / 07
Tech stack
- Front end
- Next.jsTypeScriptPWAZustandZodTailwind CSS
- 3D, motion and real time
- Three.jsReact Three FiberWebGL3D optimisation (glTF, Draco)
- Back end and APIs
- Node.js
- Data
- PostgreSQLDrizzleOpen dataADS-BGTFS-RTDatex II
- Mobile
- Sensors (gyroscope, orientation)
- DevOps, cloud and testing
- DockerDocker SwarmGitLab CI/CDGitVitestBruno (API testing)
- Security and networking
- Reverse proxy (Traefik)
- Product, SEO and methods
- SEO
Next project · 03 / 08
DeviJà
DeviJà